Let’s begin by admitting something simple but true: observability can be overwhelming. It often starts with the best of intentions: monitoring your app, making sure things are healthy, and getting alerts when they aren’t. But very quickly, it grows. You add logs, metrics, and traces. You start collecting everything. And then, one day, you realize you have all this data but no clear insight. You feel lost, buried in noise. And worse, when an incident happens, you’re still scrambling.
If observing your system ends up being harder than building it, something’s off.
We like to say in Italy that “appetite comes with eating”. The more you observe, the more you want. First, you just want to know if something broke. Then you want to know where it broke. Then you want to understand why it broke, how it impacted the rest of your system, and, eventually, how to prevent it from happening again.
But each of these steps adds complexity.
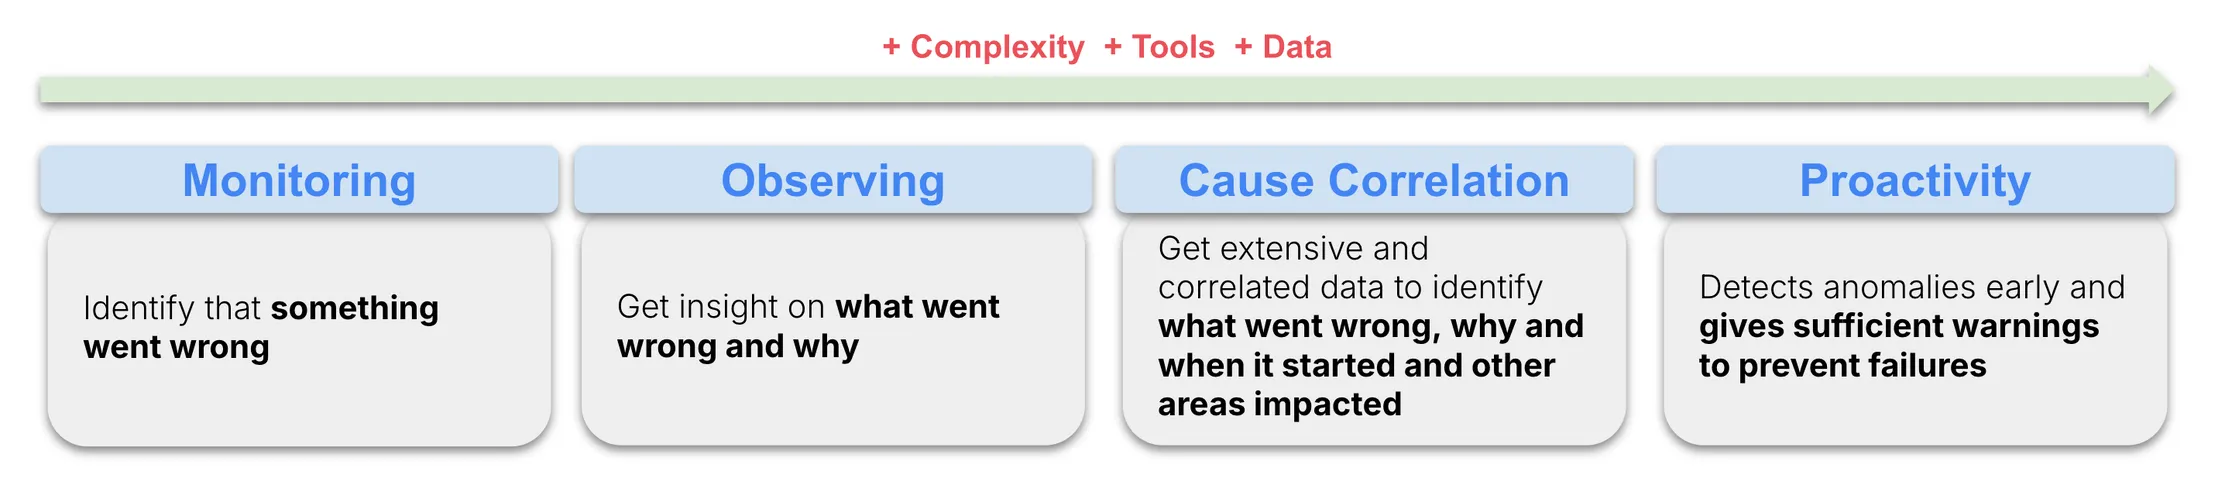
Observability is not just about having more data. It’s about having the right data and knowing how to connect the dots. Getting an alert that your app failed is only step one. You still need to figure out what failed, why it failed, and who or what else is affected. Without that context, you’re stuck in detective mode every time something goes wrong.
Imagine instead an alert that tells you, “Your order service is down because the JVM ran out of memory after 20 concurrent requests to the checkout endpoint.” Suddenly, the story is clearer. You can act quickly. You fix faster. You recover faster.
But even that’s not enough. Distributed systems rarely fail in isolation. One failure can ripple across your architecture. The order service goes down? That might mean the warehouse service can’t update inventory. Even if the warehouse logs look clean, something’s broken. Without correlation, you’ll miss the big picture.
So maybe it’s time to change how we think about observability—not as a fire extinguisher we grab when something is on fire, but as an early warning system. One that shows you not just what happened, but what might happen next.
What if your system could say: “This service is nearing its resource limit. The garbage collector isn’t keeping up. If this trend continues, we expect a memory crash within the next hour.” That’s proactive observability. That’s serving insight as the first dish.
But to get there, we need to address a hard truth: complexity is part of the journey.
Why is observability so complex? Partly because we chase insights by adding tools. And while more tools often mean more power, they also mean more learning curves, more configurations, and more mental overhead. Tooling sprawl is real, and it gets expensive, both in cost and in engineer attention.
More tools also mean more data. But without structure, that data becomes noise. You’re not gaining insight. You’re just collecting dots without a way to connect them.
And then there’s transparency. We underestimate how important it is. The most advanced observability setup in the world is useless if your engineers can’t use it easily. If they have to dig through five dashboards, ten filters, and a dozen logs to find what they need, they’ll stop using it. Insight should be discoverable, not hidden behind layers of effort.
So how do we change that?
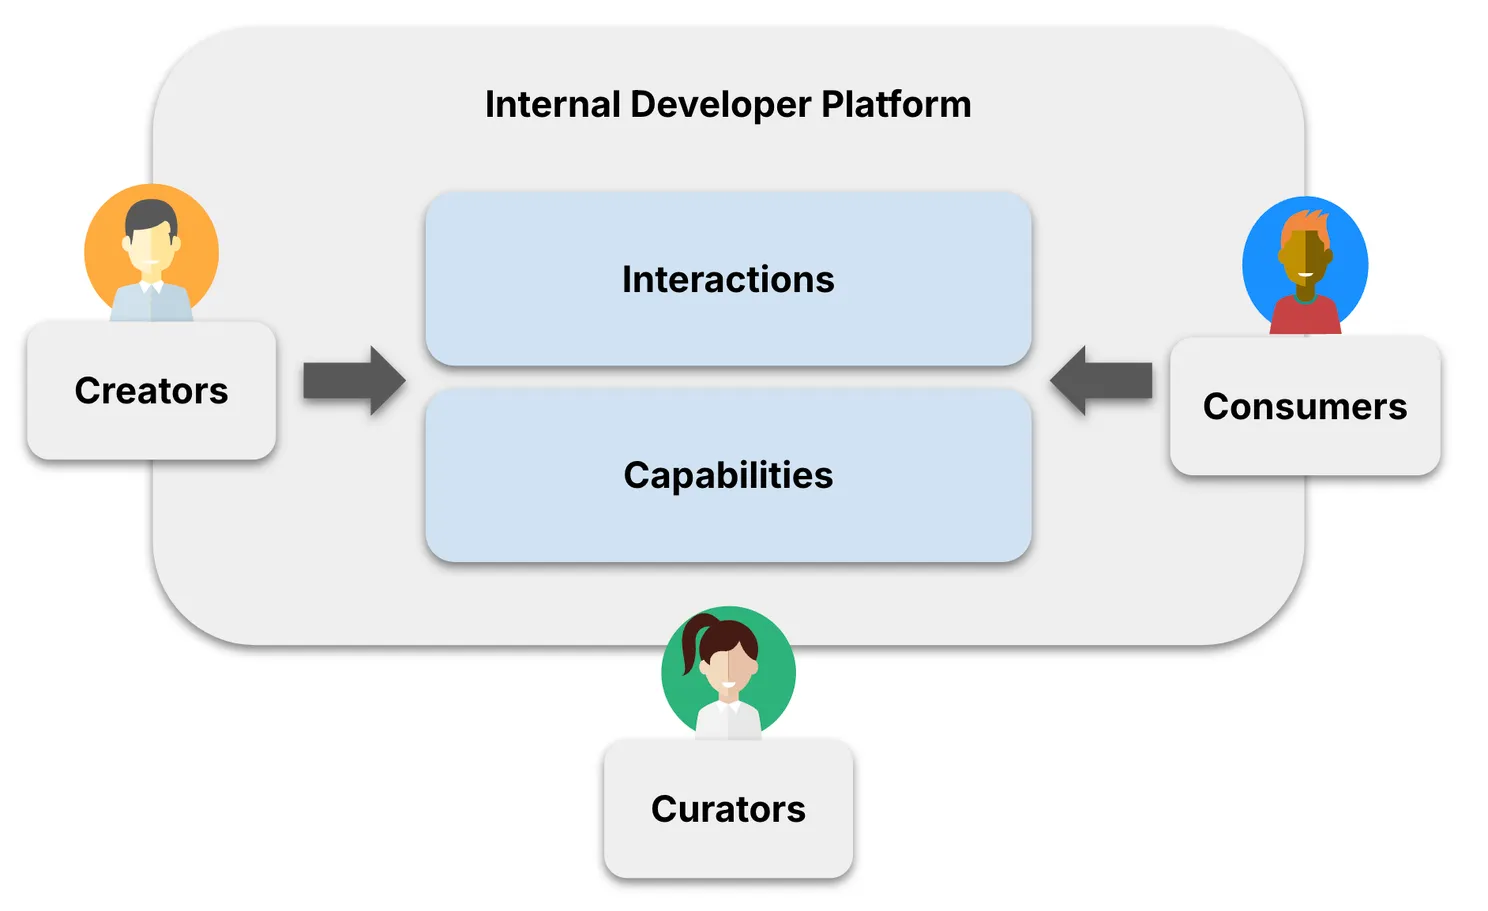
This is where platform engineering comes in. At the heart of every good platform is the goal to reduce complexity and deliver value. We do that by building, or adopting, an Internal Developer Platform (IDP). But let’s be clear: a platform is not just a fancy control panel. It’s a set of curated capabilities delivered through thoughtful interfaces (APIs, CLIs, UIs) that developers use to ship software faster, safer, and with more confidence.
An IDP isn’t a product you buy off the shelf. It’s something you craft to fit your organization. It captures value created inside your company, makes it reusable, and shares it with everyone. Think of it as a cycle. Someone builds something useful: a service, a pipeline, a configuration. The platform turns it into a standard and makes it available to others. Curators create. Consumers benefit. And platform engineers make it all work.
So what does that have to do with observability? Everything.
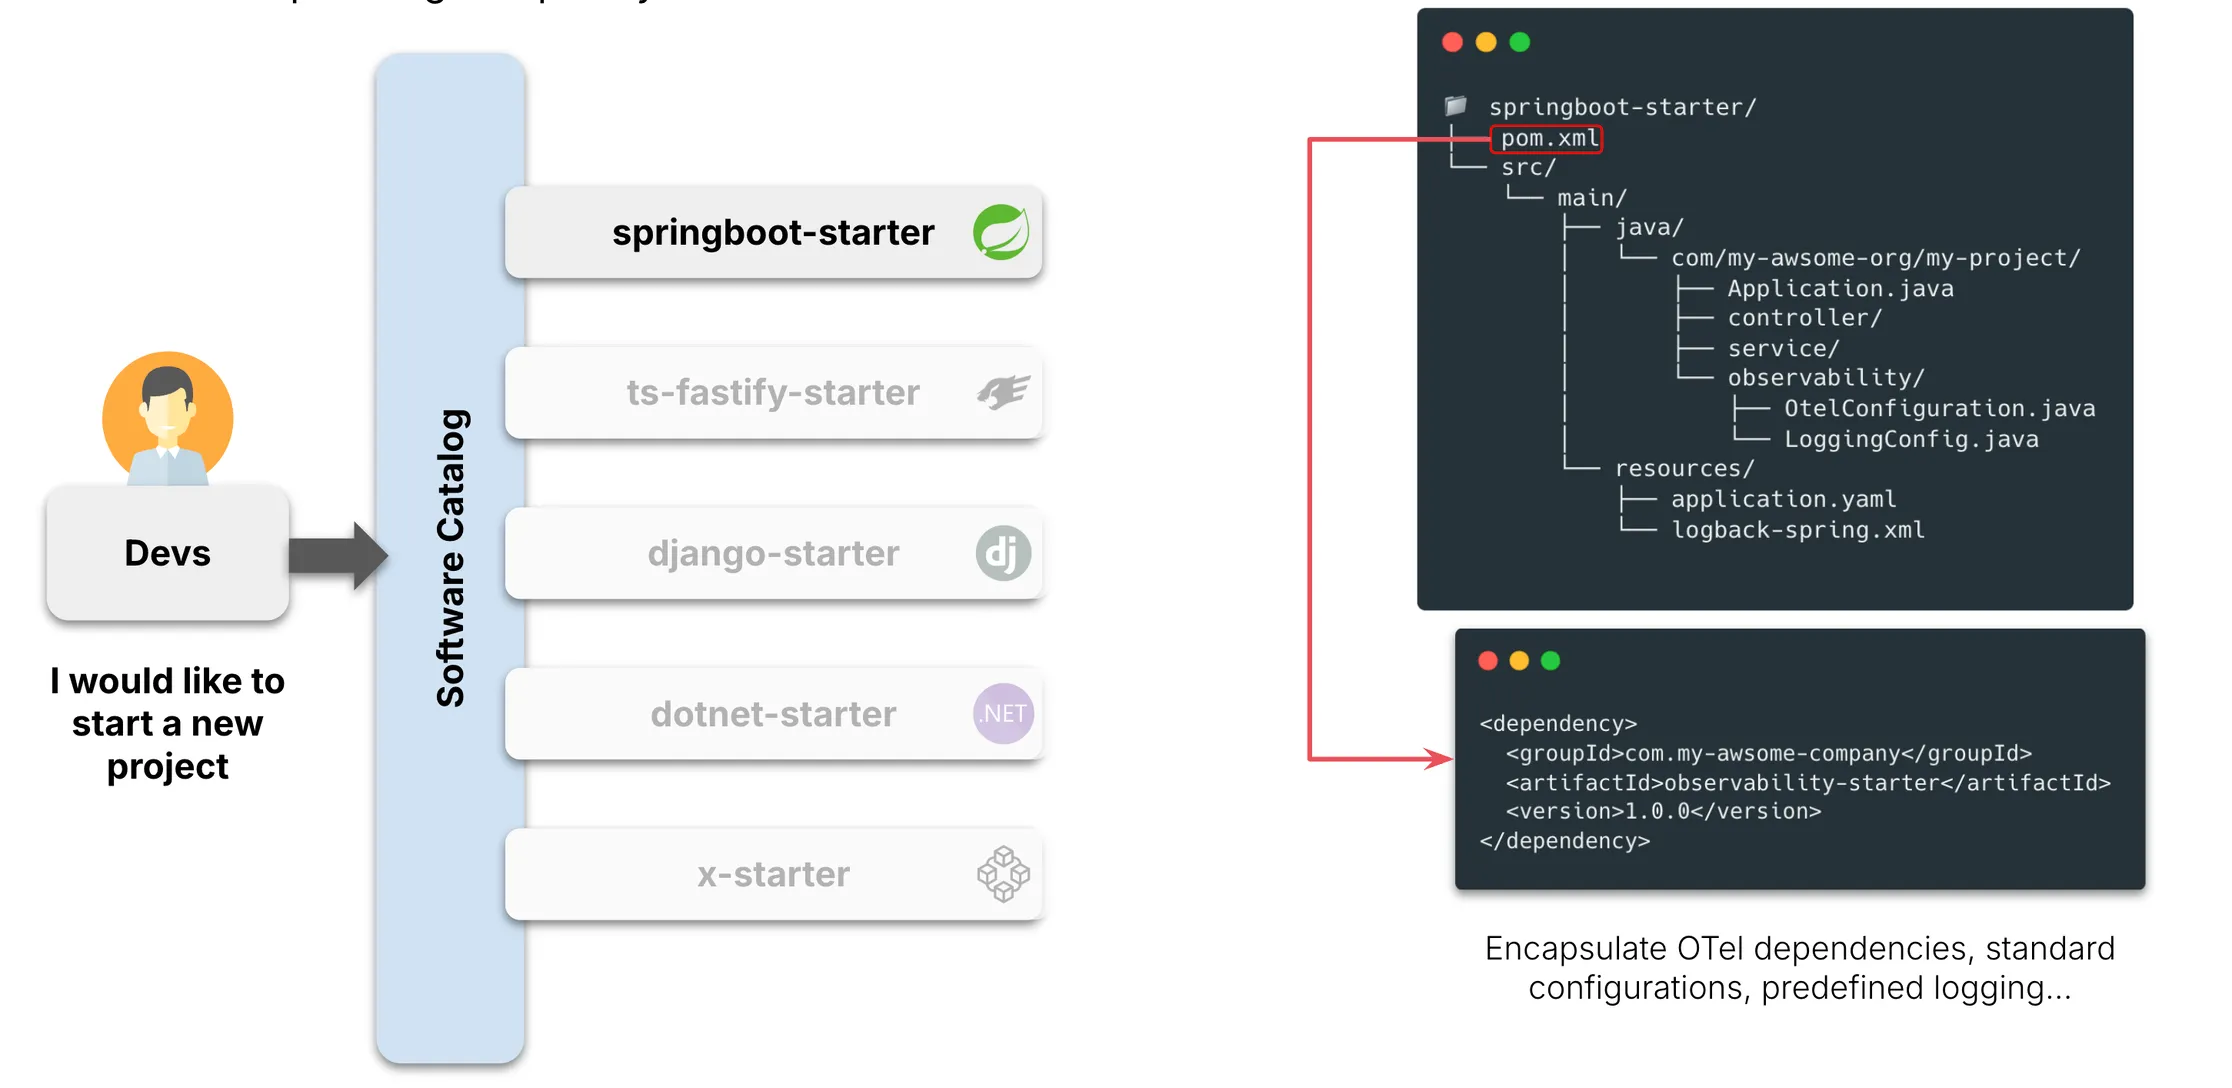
Because once you’ve built a solid platform, you can make observability a default, not a developer afterthought. You can embed it right into your blueprints, those service templates that teams use to bootstrap new projects. This is what we call a “paved path.”
Take a Spring Boot service, for example. Instead of letting each team decide how to instrument their code, we provide a standard starter: preconfigured with OpenTelemetry, logging best practices, metrics collection, and trace correlation, all baked in. No extra steps, no manual setup. Just build your logic and deploy. The telemetry is there, by default.
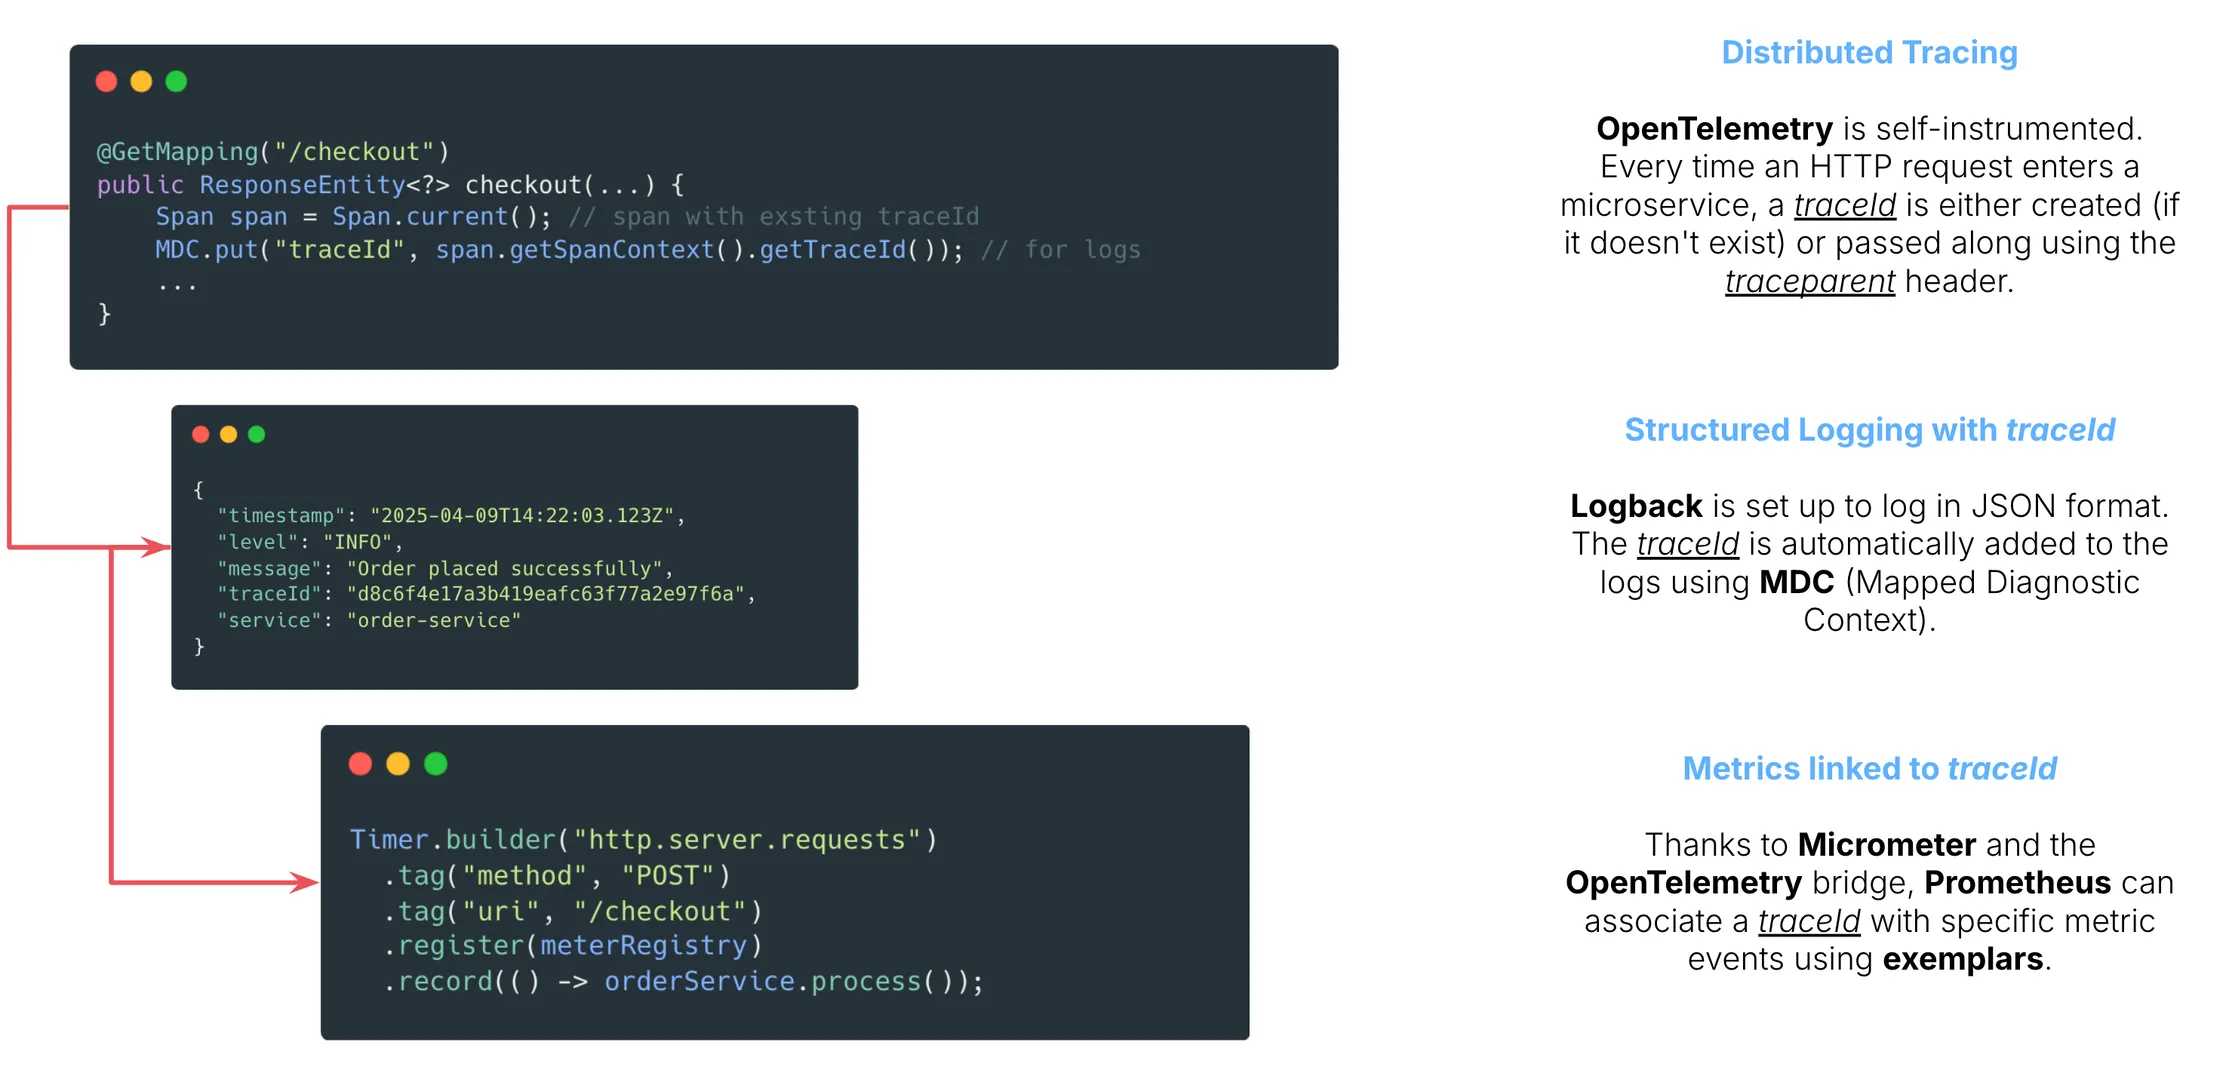
And it’s not just about traces. Logs and metrics are tied together using shared identifiers like trace IDs and exemplars. This means that if a metric spikes, you can jump directly to the related traces. If a trace shows an anomaly, you can pull the associated logs instantly. One data point leads to the next, like stepping stones across a river. Suddenly, navigating your telemetry stack is smooth, almost intuitive.
And here’s the magic: by embedding observability into the developer experience through the platform, you make it effortless. Engineers don’t have to know Prometheus, Jaeger, Loki, or Fluent Bit. They just need to use the blueprint. Write code. Push code. Get insight.
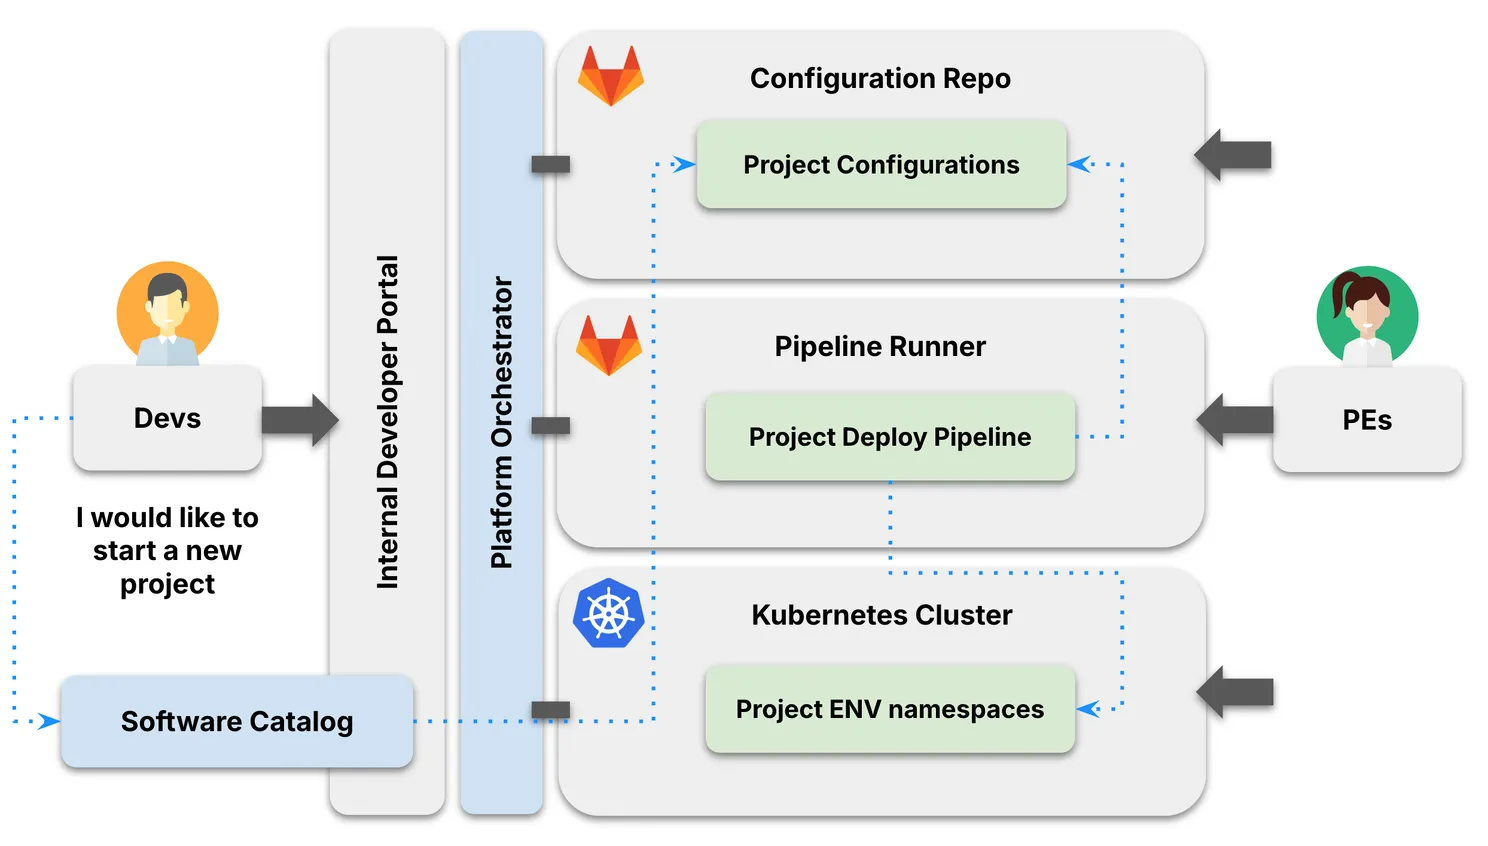
Behind the scenes, your platform engineers are setting up the clusters, managing the pipelines, and integrating the stack. Developers just interact with a portal. Need a new project? Request it. A namespace is created. Config is stored. Pipelines are ready. The observability stack is live, and everything is standardized: no ticket, no wait, no Kubernetes deep dive.
This is what we mean by abstraction and standardization. This is what we mean by building superpowers into your platform.
So what are the results?
First, developer velocity increases: they don’t get stuck in YAMLs and dashboards. Second, your telemetry data becomes structured and connected. No more data silos. Third, your stakeholders, whether SREs, platform teams, or execs, get the insight they need. Developers see performance. Platform teams see infrastructure behavior. Leaders see cost and efficiency.
When telemetry is built with intent, it stops being background noise. It becomes a strategic asset.
And maybe most importantly, your teams start asking better questions: not “what went wrong?” but “what’s about to go wrong?” and “how can we prevent it?”
That’s what it means to serve observability as the first dish. You’re not just reacting. You’re anticipating. You’re enabling. You’re giving your teams the confidence to move fast, and the clarity to move smart.
That’s the kind of appetite we want to grow.